Kālā Forecast
Project Overview
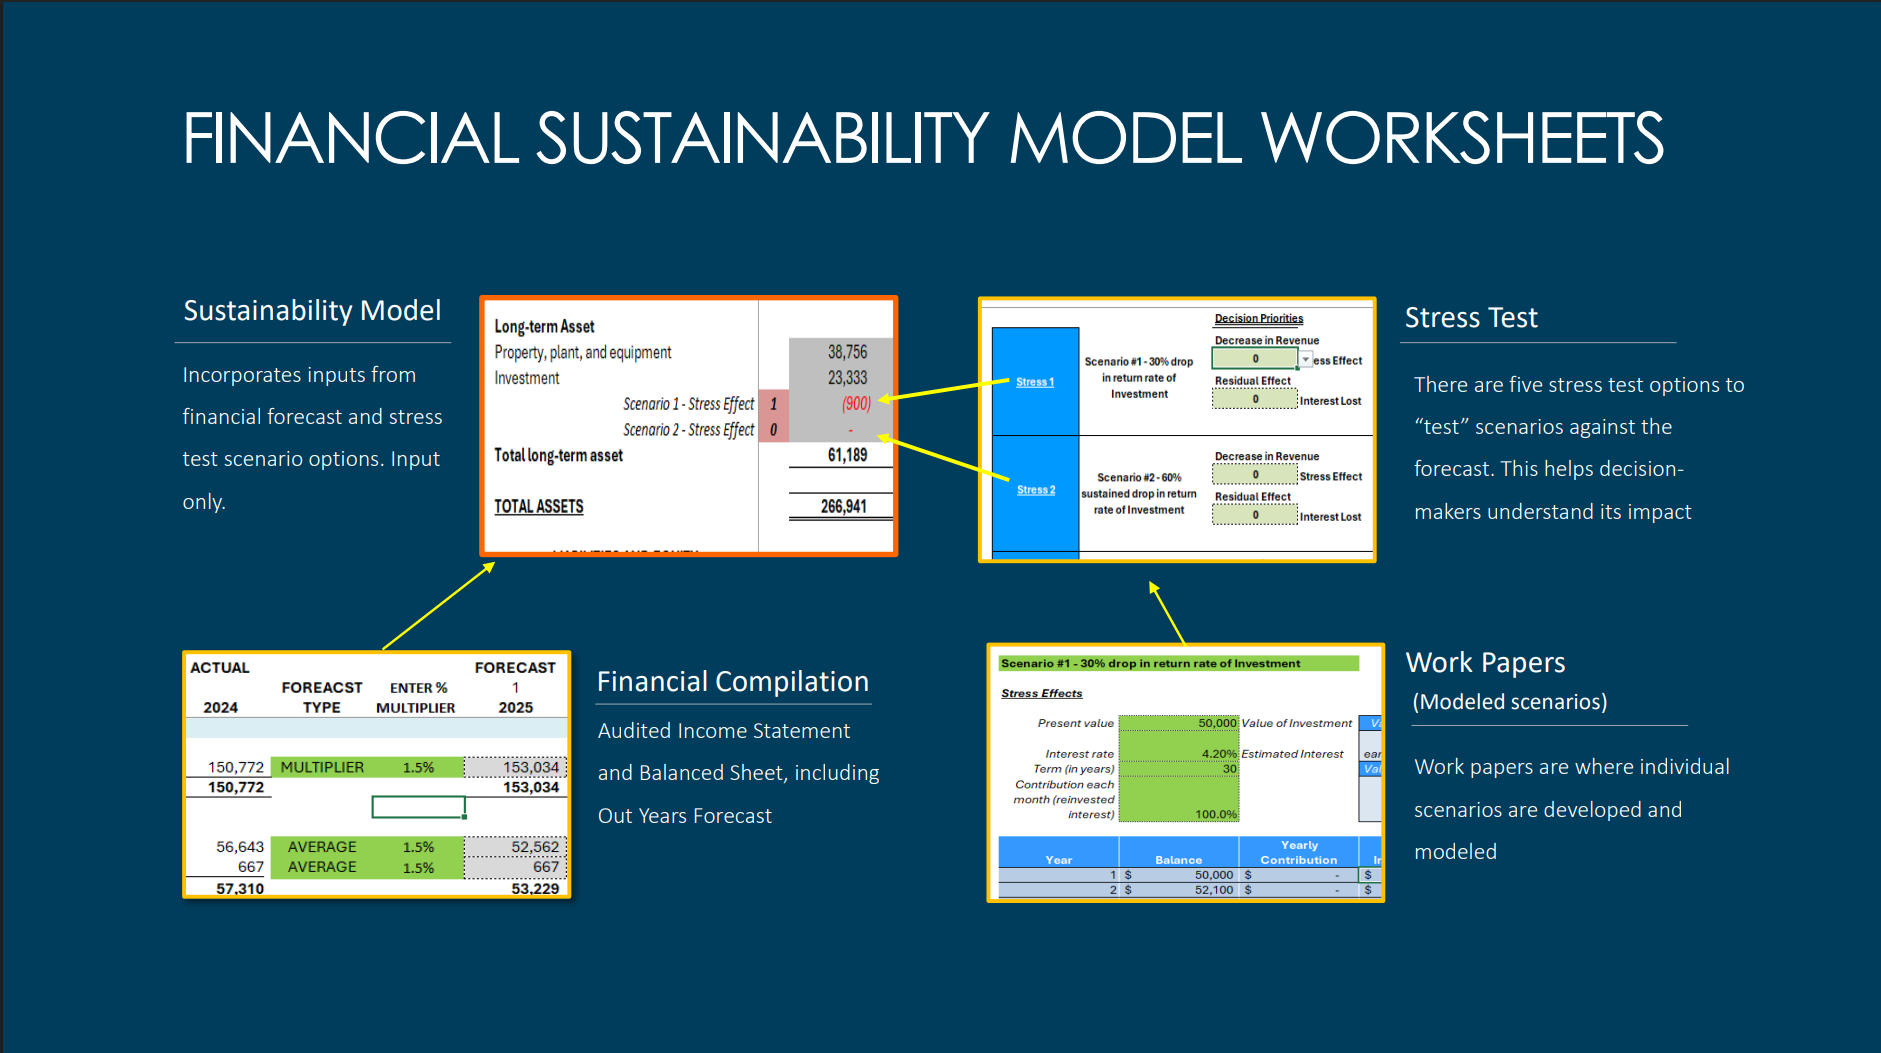
Kālā Forecast is a web application developed by myself and five peers in our ICS 414 course at the University of Hawai‘i at Mānoa. It replaces Spire Hawaii LLP’s complex, Excel-based Financial Sustainability Model with a more intuitive, integrated solution. We replaced different types of interlinked worksheets that form the core of the FSM which cover sustainability inputs, stress-test scenarios, audited income statements and balance sheets with out-year forecasts and model scenario work papers.
While working on this project, I contributed to developing the pages for landing, sign-in, sign-up and the work papers. To implement the modeled scenarios for work papers where individual financial scenarios are developed, I created a JavaScript module that contains each scenario’s default inputs and calculation logic. In a React Work Papers component, I linked that module to a dynamic interface that brings everything together.
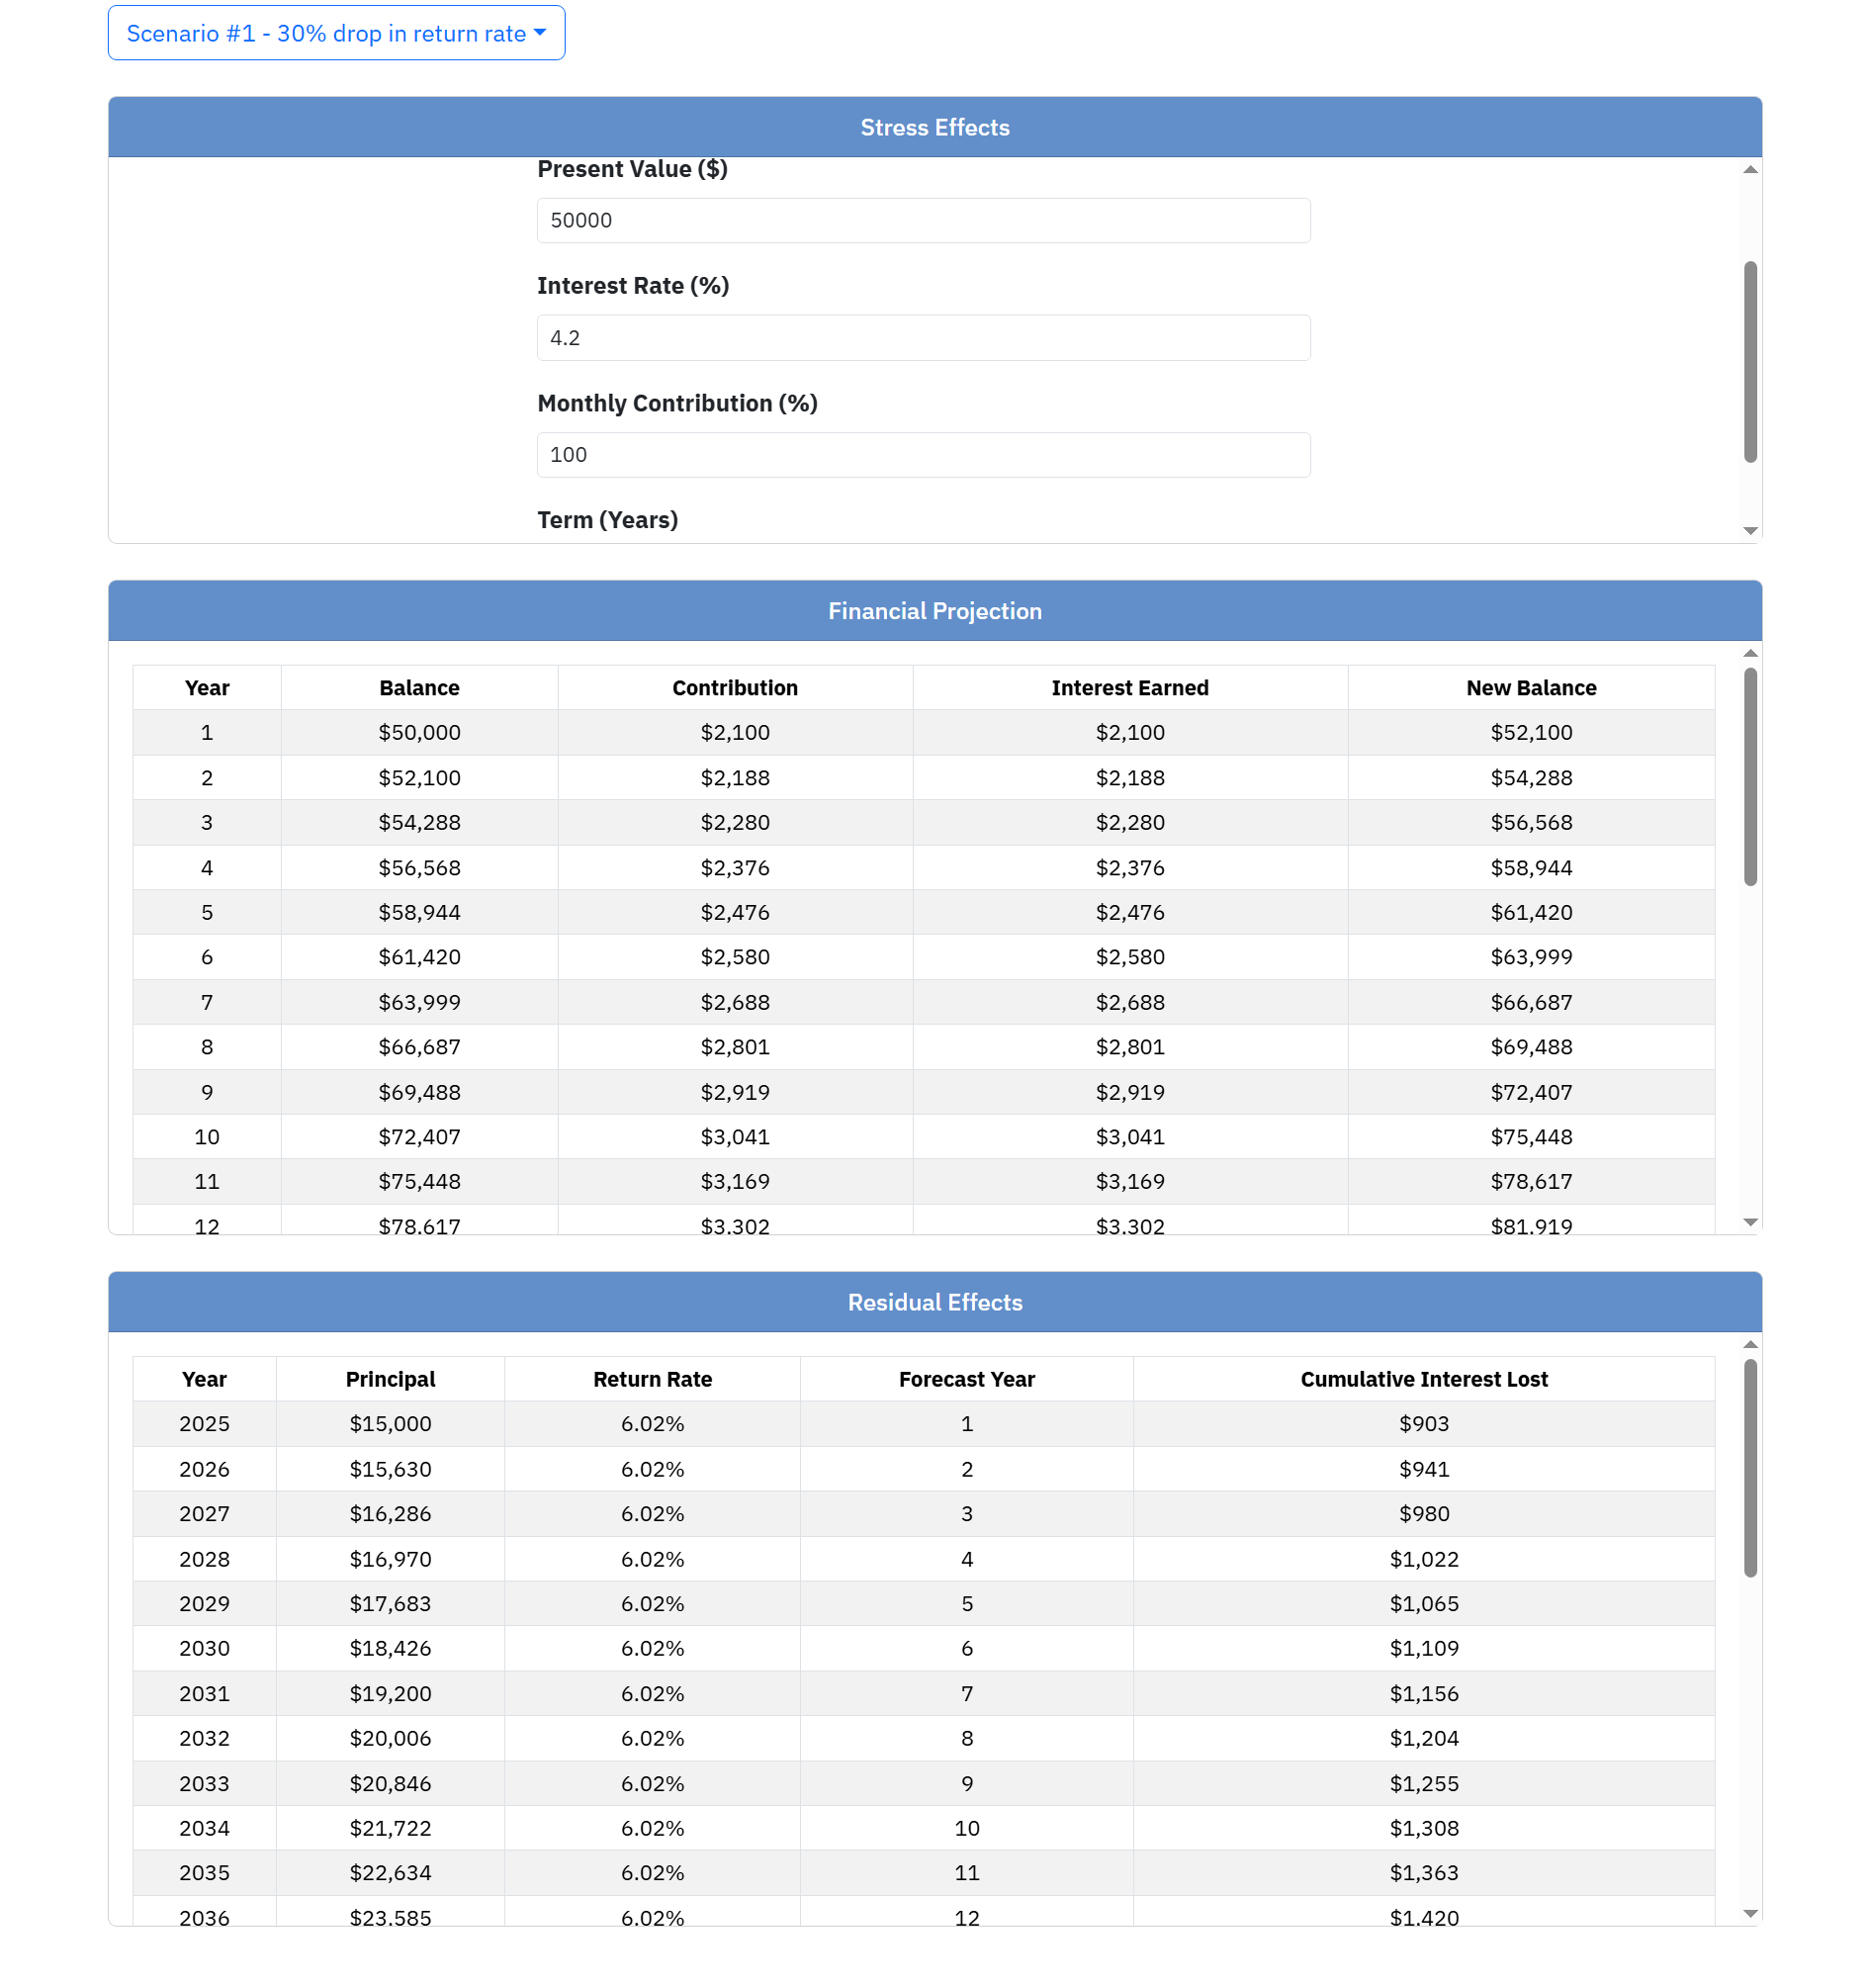
I built the Workpapers page as an interactive hub where users can explore different financial what-if scenarios. At the top, a dropdown lets you switch between predefined scenarios which cover a variety of emergency expense shocks to loan amortization analyses. This is so stakeholders don’t have to hunt through dozens of Excel tabs to compare cases. Once a scenario is selected, a form that adapts the chosen fields to whatever inputs are relevant: interest rates, contribution amounts, forecast years, or specific expense entries for a given month. This makes it easy for users to tweak assumptions, with every change being wired to update the underlying data model immediately.
Below the form, I added several tables that present both the immediate stress effects and the longer-term residual effects of each test. I structured each scenario’s calculation logic in modular JavaScript objects so that adding new tests or adjusting formulas is straightforward. Those updates flow into the Work Papers page without rewiring the user interface. Altogether, these features provide a platform for the previous spreadsheet model into an intuitive web interface so that decision-makers have access to fast, hands-on control over their financial forecasts.

Further Experience
As a result, I was able to improve my JavaScript, CSS, React and Bootstrap capabilities even more much like a previous project from an ICS 314 course. I was able to learn how to collaborate in Git-based workflows, using code-review etiquette and branch-management so that there were no lingering conflicts with project functionality. Though there were some hitches in team and project management, these experiences as a whole helped me gain an in-depth insight into the world of business software development, with a focus on bridging financial data logic and the user experience.